Metadata 101: Weather

As I write in my book, Nature Journaling for a Wild Life, your field journal or nature journal is so much more than “just pretty pictures.” You record a great deal of information about the world around you—and that information I call “nature data.” This includes observations about what is blooming, what animals you are seeing, what they are doing (feeding, on what? sleeping or flying?), and so on.
There are other data that are also critically important—the “metadata,” which literally means the data that goes with other data. This information includes where you are (latitude / longitude, elevation), the time, sunrise and sunset times, moonrise and moonset times, temperatures, and the weather.
Why do you want all that in your field journal? That information is incredibly useful for giving deeper meaning to what you observe. Say you are exploring in early June in southern Arizona and you note a lot of Ghost Brimstone butterfly activity, which seems a bit early for the region, which is hot and dry during that time and not great for butterflies. You take good notes on their numbers, and do a sketch and describe their appearance. Then you note the weather: cloud cover, cloud types, wind speed and direction, and so forth. If you can, you look up the relative humidity.
Later, you do some research and find out that these butterflies often precede summer thunderstorms in the Sky Island region, moving up from the south with the storms, and sure enough a week later the monsoons start a bit early. Your metadata helps you and others who might access your notes observe that the week before, the relative humidity was in the single digits but when you observed the butterflies, it had jumped up to double digits and there were cumulus clouds on the southern horizon. Bingo: your metadata may help correlate butterfly activity to local storm activity.
I’m often asked about the symbols I use in my field journal for recording the weather—in the image above, note the symbols in the upper right. These are taken from the classic meteorologist shorthand for recording weather at weather stations. When I was in grade school, my dad made me a classic white-louvered weather station and stocked it with high-low thermometer, rain gauge, barometer, and anemometer. We printed out special sheets from the National Weather Service and I instantly became a life-long weather nerd. More than a decade later, when my husband and I became caretakers at a remote wildlife refuge, one of our duties was to record the weather via the weather station (yes, in a white-louvered box) at 4 pm every day. Of course today nearly all official weather stations record the data automatically and upload to servers, but I still love to write mine by hand.
Below is the cheat-sheet I use for the classic weather symbols. I don’t do it exactly as a weather station, just picking and choosing what I want to focus on. I keep a copy of this in the front of my journal. Click on the chart to open / download.
And here are some apps for your phone for looking up other useful metadata:
Sunrise / Sunset: Sun n Moon (iPhone), lunasolcal (android)
Location: Backcountry Nav (Android); MotionXGPS (iPhone)
Weather: MyRadar (iphone, android)
Tides: tide alert - NOAA (iphone); tide charts (android)

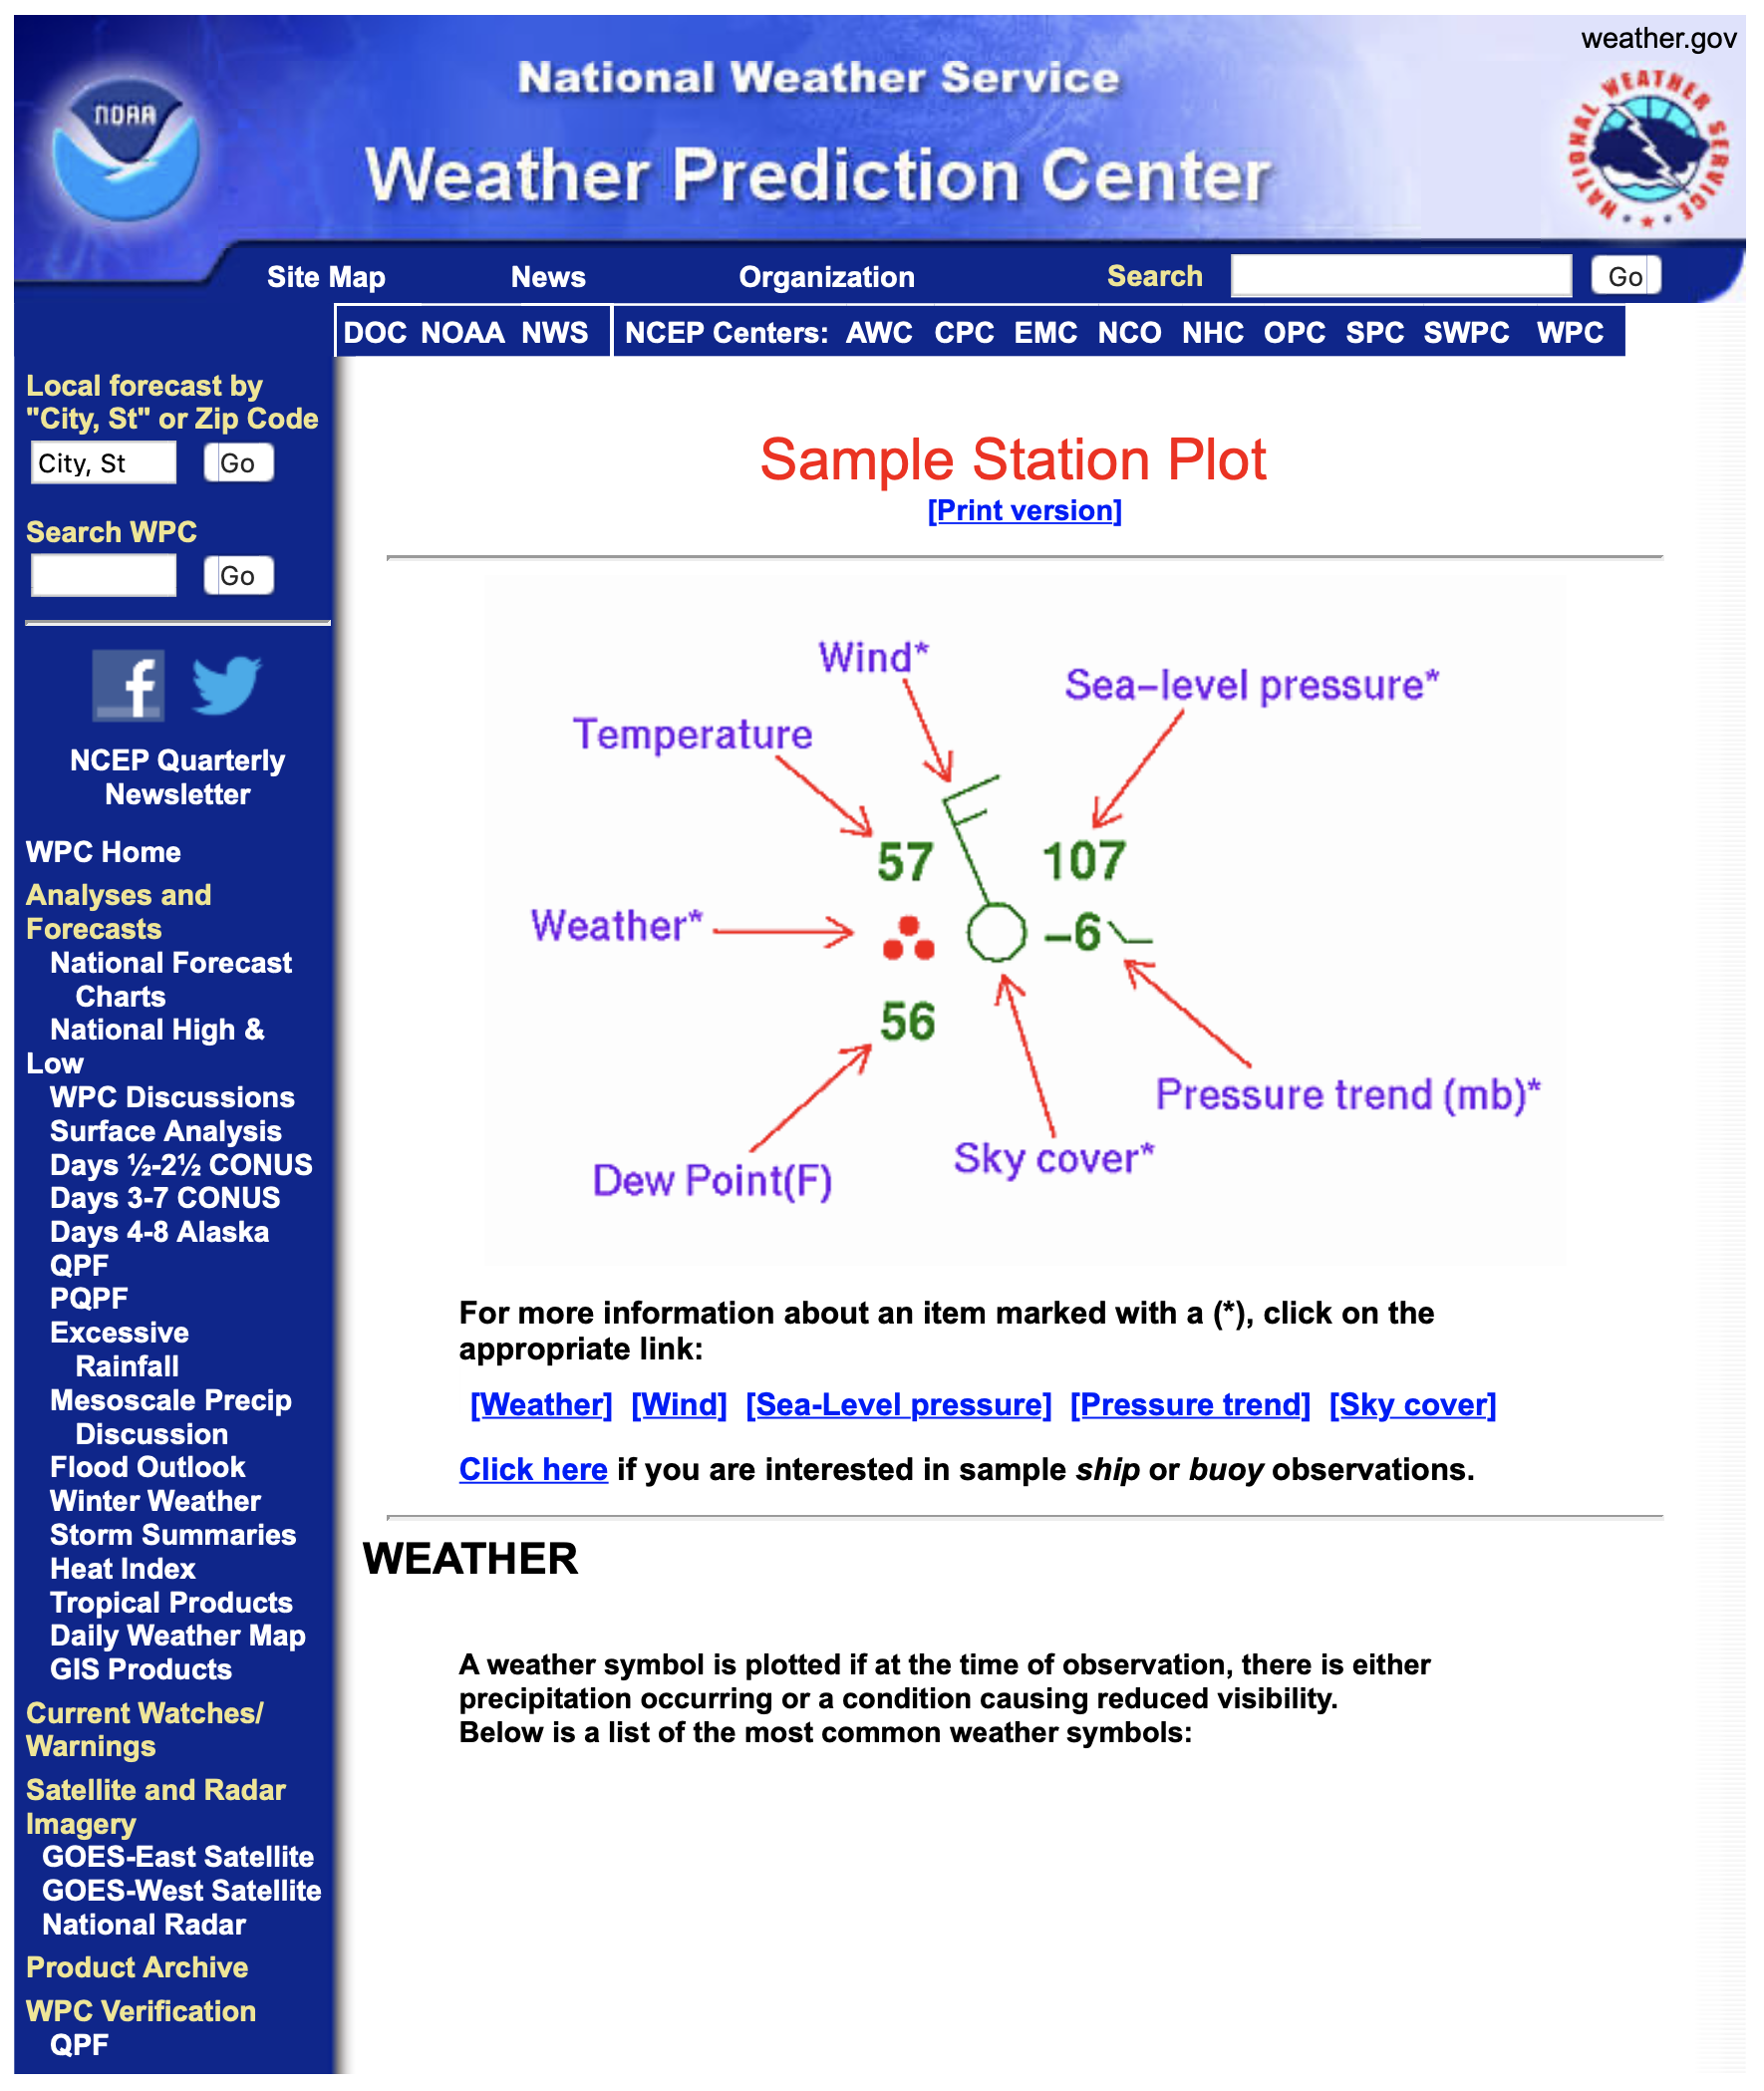
The National Weather Service has an excellent guide to the symbols and how to use the format for station plots (though you can set it up any way you like for your own data collection, using whatever information you want, or not). Access the page at their website via this link (click on “print version” for a PDF):
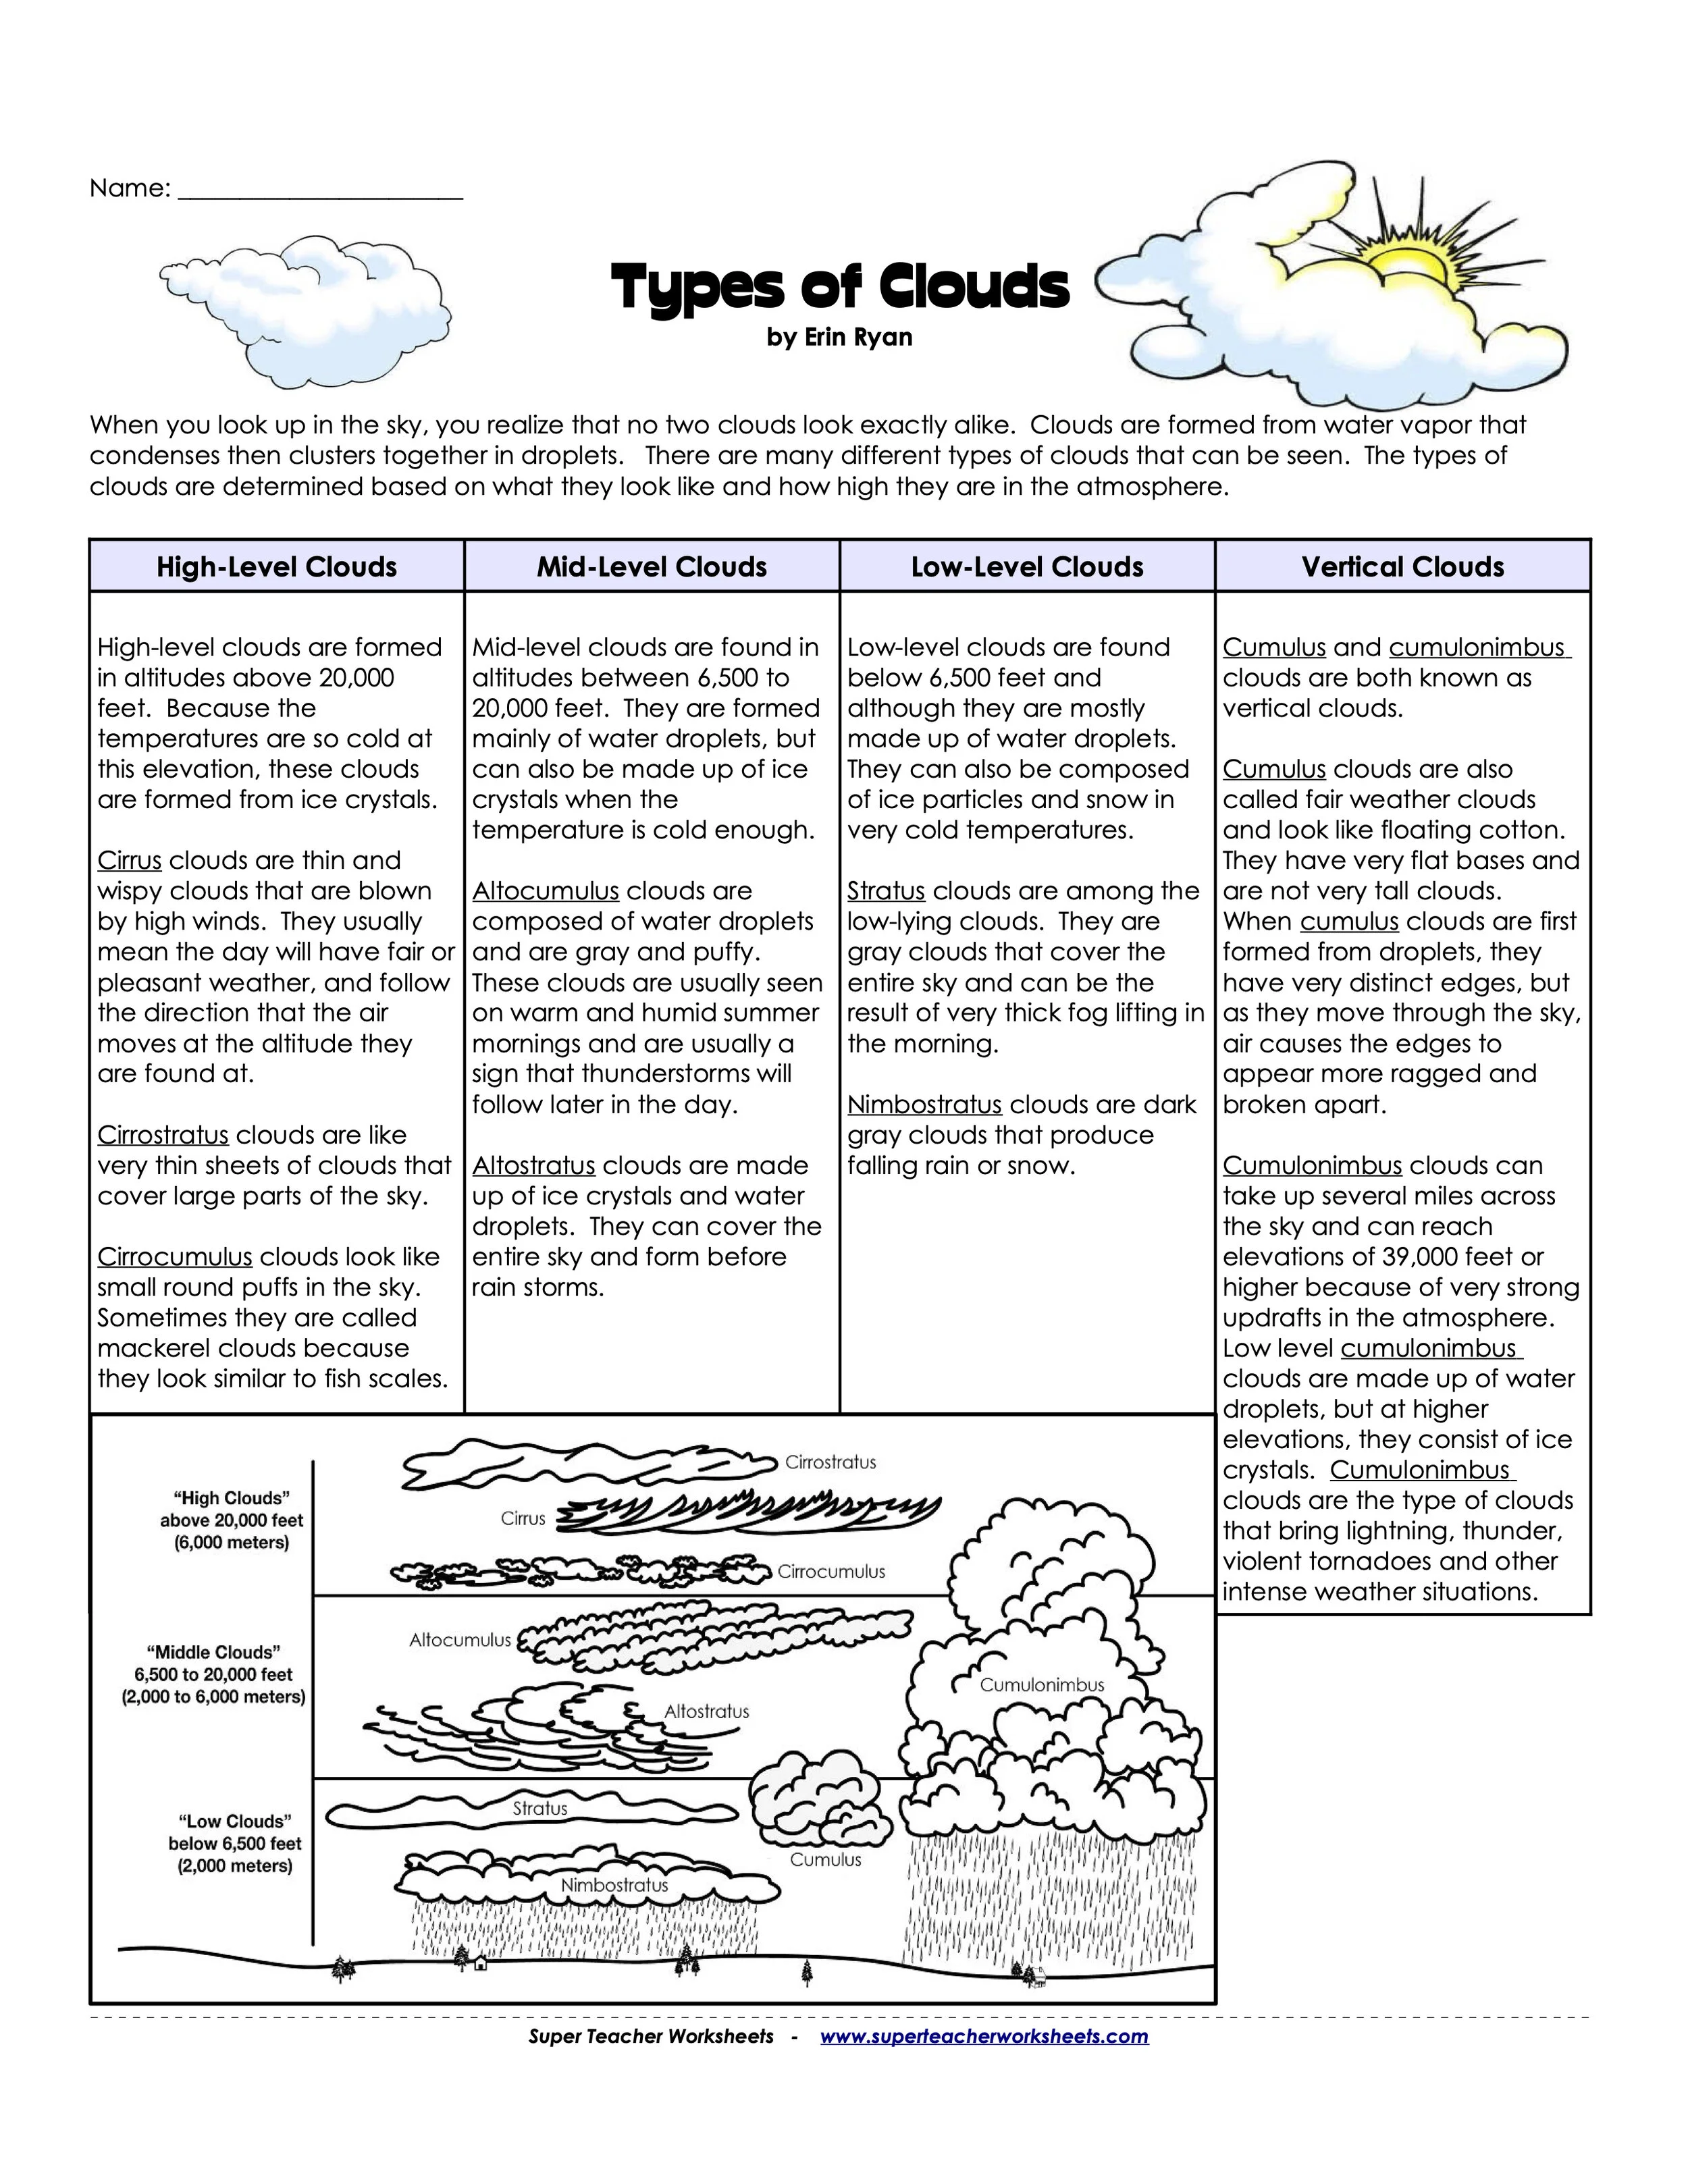
You can also create your own page for the front of your journal depicting cloud types and adding their altitudinal ranges and symbols from the charts above. I used Erin Ryan’s Types of Clouds worksheet from SuperTeacherWorksheets.com.