Roseann hosts the Constant Apprentice blog as a place for curious humans to explore craft, visual arts, writing, nature, food, and all things classic, then and now. For Jonathan’s blog, select the Overland Tech & Travel tab.


JOIN OUR FACEBOOK GROUP FOR BEGINNING JOURNALISTS AND FIELD SKETCHERS!

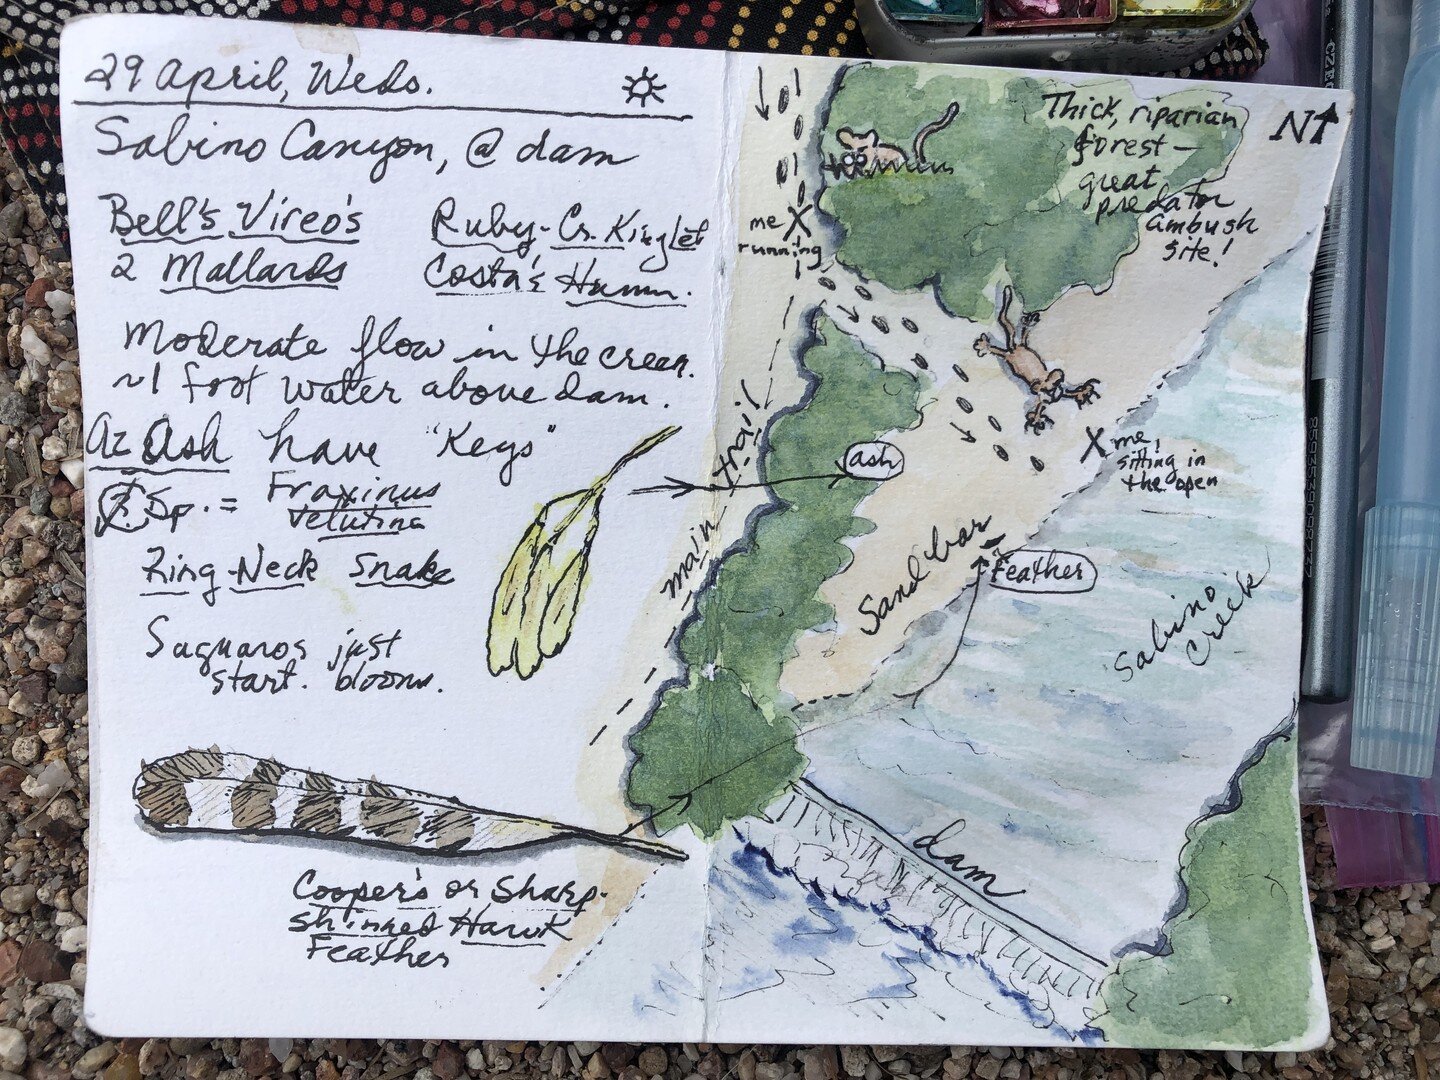
JOIN THE SOUTHERN ARIZONA NATURE JOURNAL CLUB

Sign up for periodic updates—free tutorials, new books, essays, and more! We don’t over-do it, promise.
ROSEANN HANSON hosts the Constant Apprentice field arts and science blog as a place for curious humans to share exploration & enquiry through science, nature, writing, visual arts, and classic crafts, historical and present. [About Roseann]
{Science} {Visual Arts} {Writing } { Craft } { Travel } {Nature} {Classes}


Posts by Interest
- Bootcamp 6
- Field Arts 26
- New Mexico 3
- Travel 51
- Books 6
- #naturejournaling 1
- Art and Science 2
- Idaho 1
- Montana 1
- Master of Field Arts 1
- Desert Laboratory 1
- Tumamoc 2
- Metadata Mnemonic 1
- Natural Pigment 11
- Mars 1
- SoAzNatureClub 1
- Index 1
- Gift 2
- Overlanding 12
- Class 6
- Feral Watercolor 1
- COVID 1
- Journal 20
- Nature 71
- November 2019 1
- Sonoran Desert 1
- Creative Process 9
- Africa 24
- Kenya 7
- Land Rover 2
- Culture 3
- Grand Canyon 3
- Overland Expo 2
- Ravenrock 59
- Conservation 12
- Mexico 9
- Food 12
- Asia 1
- Plants 2
- Tucson 1
- Brooks 2
- Raleigh 4
- Recycled Art 2
- Porsche 2
- Tanzania 11
- El Aribabi Conservation Ranch 5
- U.S. 13
- Motorcycle 1
- I {heart} . . . 3
- Found Object Art 1
![Around the World in 80 Rocks, Fossils, and Formations - No. 5, Africa (pt. 2) [FREE workshop]](https://images.squarespace-cdn.com/content/v1/5395fbd3e4b003747ed3b60a/535876a1-f577-471c-9cab-77c9ed186832/Egypt57.jpeg)